STARTWAVE
STudies in Atmospheric Radiative Transfer
and Water VApour Effects
Time Series of Rain Rate
The rain rate is estimated by an opacity physical retrieval method (see Wang et al. 2021) using ground-based microwave radiometer data (21.4 and 31.5 GHz) of the TRopospheric WAter RAdiometer (TROWARA) at Bern, Switzerland. The method firstly establishes a direct connection between the rain rate and the enhanced atmospheric opacity during rain, then iteratively adjusts the rain effective temperature to determine the rain opacity, based on the radiative transfer equation, and finally estimates the rain rate.
The plots below shows the time series of the accumulated precipitation (day, month, year). TROWARA rain rate estimations are compared with the available simultaneous rain rate derived from rain gauge data and reanalysis data (ERA5). The monthly rain rate is the accumulated precipitation per month in mm/month, and the annual rain rate is the accumulated precipitation per year in mm/year, contains four variables:
- 21GHz: the rain rate estimated by TWOWARA at 21GHz
- 31GHz: the rain rate estimated by TWOWARA at 31GHz
- Rain gauge: the rain rate measured by the rain gauge (ExWi and Bollwerk weather station)
- ERA5: the rain rate provided by ECMWF Reanalysis v5 (ERA5)
Real time rain-rate estimation
Update every day at 6:00 PM, the latest data is 3 days ago.

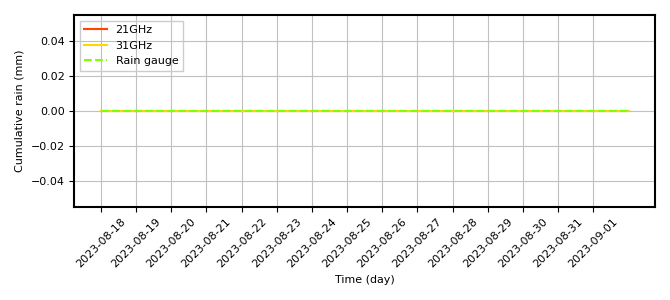
Real time series of the rain rate for an opacity physical retrieval method at 21 GHz (solid red), at 31 GHz (solid yellow),and rain gauge (dashed green) in Bern for 15 days, ILWR=0.4 mm .
Monthly rain-rate estimation

Monthly time series of the rain rate for an opacity physical retrieval method at 21 GHz (solid red), at 31 GHz (solid yellow), rain gauge (dashed green), and ERA5 (dashed blue) in Bern over the period 2004 to 2019 (192 months). Months without rain are 0, and it is assigned as NaN when the data is missing.
Annual rain-rate estimation

Annual time series of the rain rate for an opacity physical retrieval method at 21 GHz (solid red), at 31 GHz (solid yellow), rain gauge (dashed green), and ERA5 (dashed blue) in Bern over the period 2004 to 2019 (16 years).
Contact last update: April 2022
