Training 2: Saharan dust over Bern
The Institute of Applied Physics operates a ceilometer which can monitor the cloud base height. The ceilometer is a vertically pointing lidar which emits infrared laser pulses at a wavelength of 1064 nm. A small fraction of the emitted electromagnetic waves are elastically backscattered by water droplets and dust particles (aerosols) in the atmosphere. Elastic means that the wavelength of the light does not change after the scattering process.
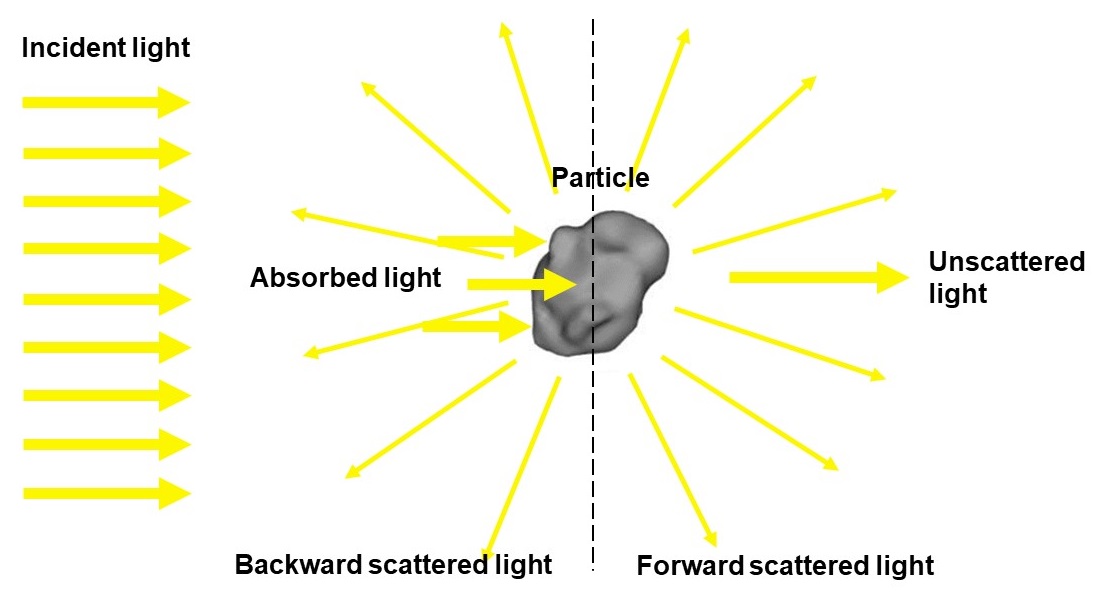
Figure 1: The scheme explains the scattering of incident light by a particle in the atmosphere.
The ceilometer measures the signal travel time between the initial pulse emission and the echo reception by the ceilometer at the ground. The altitude of the aerosols is given by h=0.5 c t where t is the travel time and c is the speed of light. The strength of the received signal informs about the concentration of the aerosols.
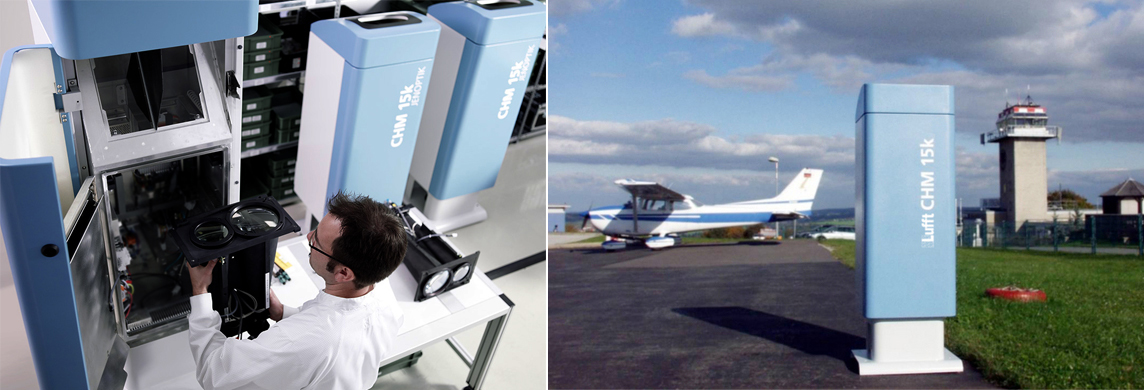
Figure 2: The ceilometer CHM15K at the factory and in operation.
The range corrected signal (RCS) of the echoes can be expressed as a signal to noise ratio and can be shown as a function of height and time. Figure 3 shows our measurements of enhanced backscatter signals from clouds and Saharan dust (red pattern, lower right corner) above Bern.
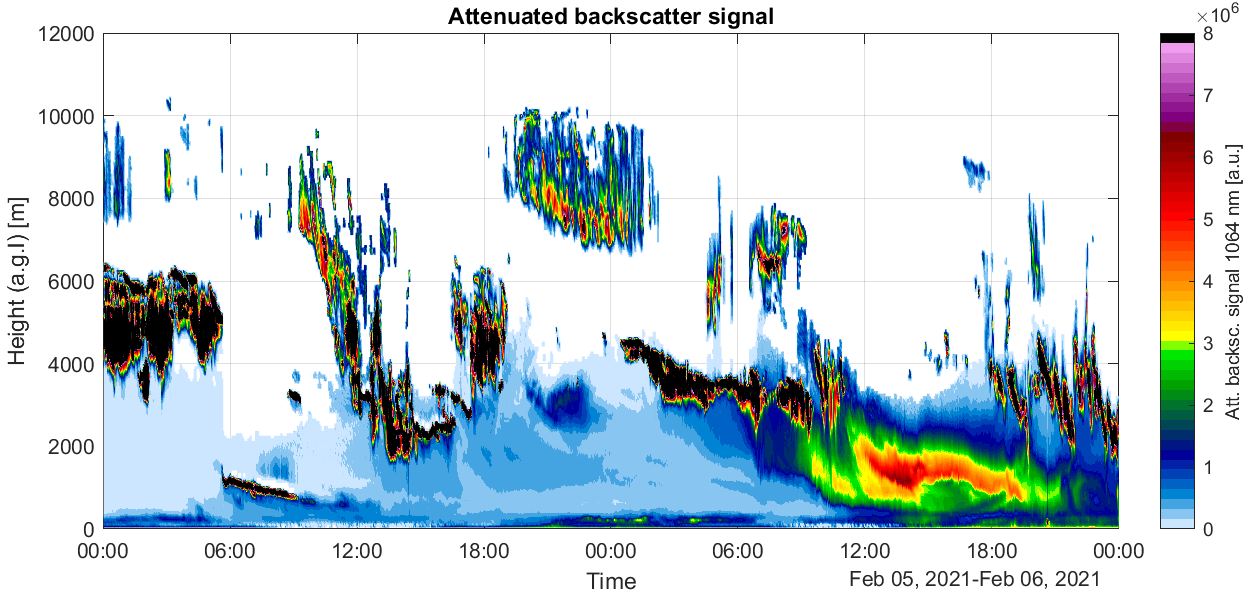
Figure 3: Backscattered signal intensity measured by the ceilometer in Bern over two days (5th and 6th of February 2021). The Saharan dust event was in the afternoon of the 6 February 2021 when a lot of aerosols were in the atmosphere below 2000 m height.
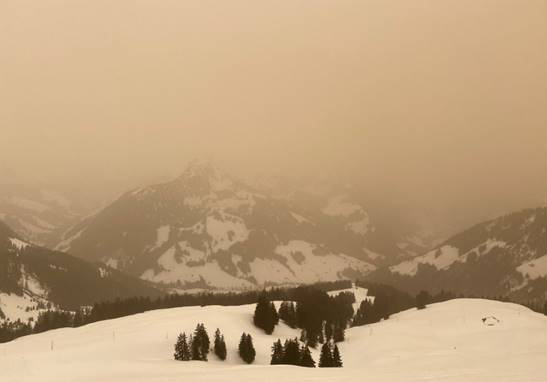
Figure 4: Left: Saharan dust event of 6th of February 2021 in the Fribourg prealps. Right: Skiing in Sahara dust on February 6, 2021, video source from SRF Meteo on Twitter.
Does the dust really come from the Sahara?
By means of a back trajectory analysis one can explore the origin of the air parcels which we observed on 6 February 2021, 13:00 UT in different altitudes above Bern. For computation of the back trajectory, we need to know the global wind field in the first week of February 2021. We start at the latitude and longitude of the ceilometer in Bern. From here an air parcel is traced backward in time by using the 3D wind vector at the current location of the parcel. Generally, the assumption of air parcels which are moving through the atmosphere is in most cases fulfilled. Mixing and diffusion processes of the air may limit the valid time range of a back trajectory to a few days. While back trajectories inform about the origin of air masses at a location, forward trajectories can be used to forecast the impact of an air pollution event (e.g., accident in a chemical factory) to different regions.
Trajectories of air parcels can be computed here.
- Please select: Compute archive trajectories.
- Source location is the place of the ceilometer at Bern (lat=46.95°N, lon=7.44°E) and the time point (6 February 2021, 13:00 UT).
- The archived meteorological file should be for the first week of February 2021.
- After selection of more parameters (e.g., back trajectories for 72 hours at three height levels), you will get an image of the back trajectories on a geographic map.
- Master Solution
In Figure 3 you can see that at 5 February 2021 3:00 UT almost no aerosols are below 2000 m. Please compute the back trajectories also for this "no dust event".
What can you say about the origins of the air parcels for the dust event and the no-dust-event?
Please tell some effects of Saharan dust transport on nature and civilization. Is there an impact on glaciers?
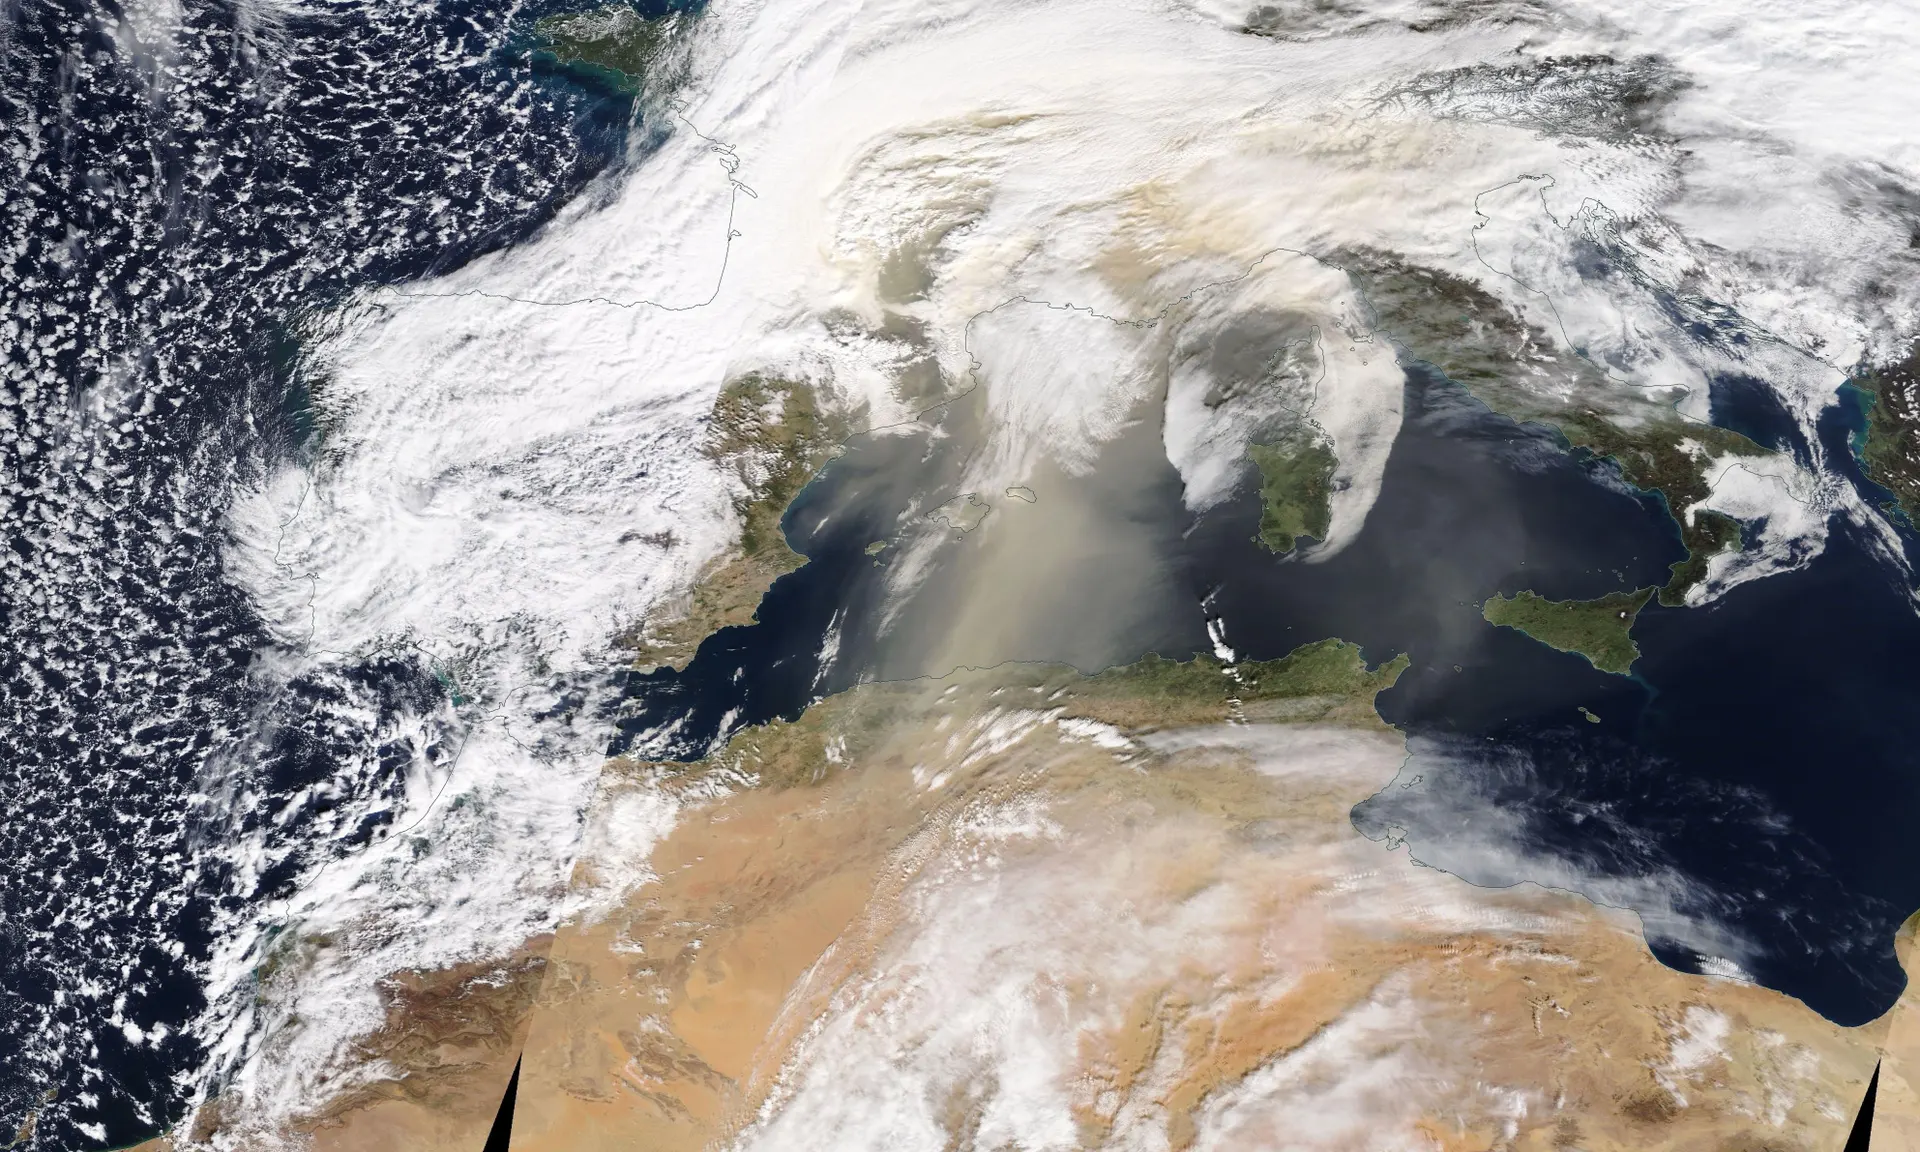
Figure 5:True color image of satellite instrument NASA TERRA/MODIS on 6 February 2021.
Contact last update: March 2023