Training 3: Searching for the weak, periodic signals of atmospheric tides in surface air pressure at Bern
History and background of tides
Oceanic tides are well known from the sea side where ebb and flow (Ebbe und Flut) are separated by about 6 hours and 12.5 min. The tidal period is 12 hours and 25 min which is the half of a lunar day. Since several hundred of years it is known that oceanic tides are driven by gravitational and centrifugal forces of the earth-moon system (Additional gravitational forcing by the sun can increase the oceanic tides).
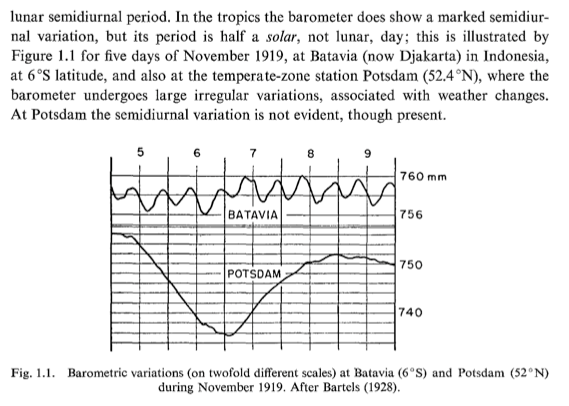
The origin of atmospheric tides was unclear until the 1960s! Fig. 1.1 shows an old measurement of the surface air pressure at Batavia, Indonesia (Courtesy of Lindzen and Chapman, Space Science Reviews, 1969):

The barometric variations at Batavia clearly show a semidiurnal variation (period: 12 hours). This is the reason why some researchers thought that the atmospheric tides have a similar origin as the oceanic tides. Other researchers believed that periodic solar heating of the atmosphere is the main reason for the tides. But they could not explain why there is apparently no diurnal tide (with 24 hour period) at Batavia?
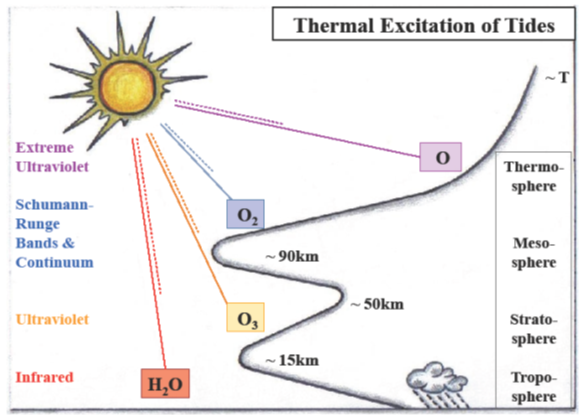
In the 1960s, it was shown that atmospheric tides are excited by about 60% in the stratosphere (absorption of solar radiation by ozone) and by about 40% in the troposphere (absorption of infrared radiation by tropospheric water vapour). The vertical structure of the atmosphere favours, however, the propagation of the semidiurnal tidal wave. Above 70 km altitude, the solar tides are quite large and dominant (horizontal wind amplitudes of the tides are about 50 m/s). In the upper atmosphere, the lunar tides (due to forcing by the moon) can be measured and play a role too. Generally, atmospheric solar tides are planetary waves with periods (24 hour/n) with n=1, 2, 3 ...

Figure 2: Scheme for tidal wave generation by solar heating of the atmosphere. The vertical profile of the temperature is sketched by the black curve (Courtesy of Hagan et al.).
Measurement of surface air pressure


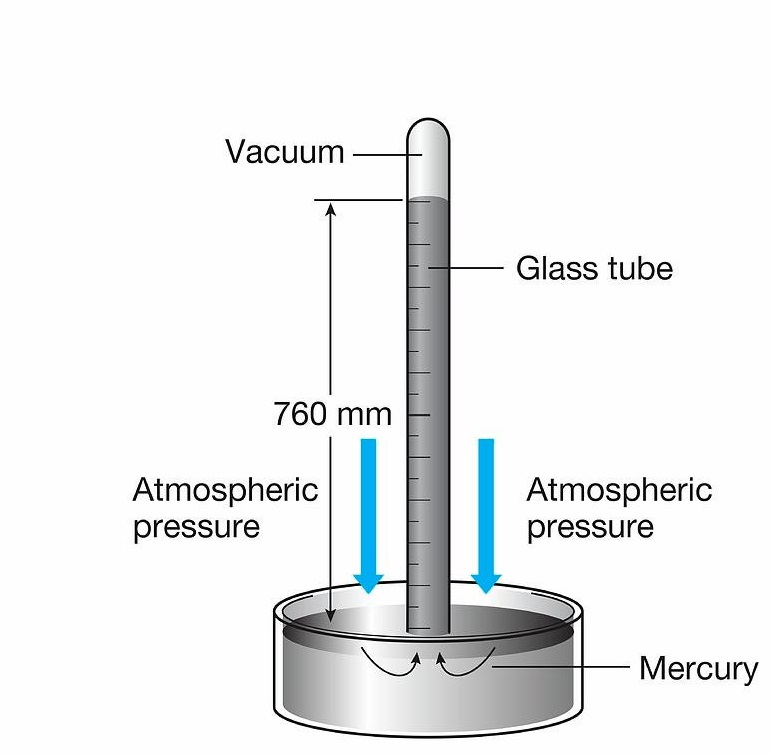
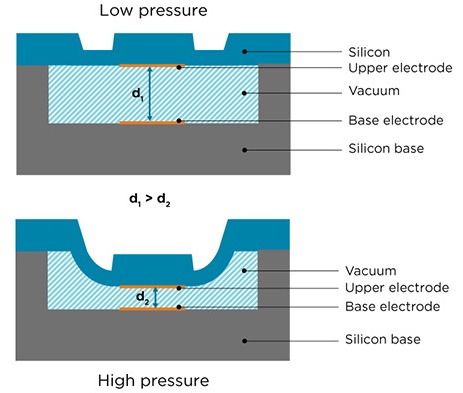
Figure 3: Left: Mercury barometer. This explains the "760 mm" at the axis in Fig. 1.1. If the pressure increases the height of the mercury column increases. Right: BAROCAP micromechanical sensor.
The Institute of Applied Physics (University of Bern) operates a Vaisala WXT-536 weather station with a BAROCAP sensor. Variations of air pressure induce changes of the capacitance of the sensor which will generate a measurable electric signal.
How many kilograms of air are above you?
Surface pressure is given by the vertical integral from the surface to the top of the atmosphere: p=∫ ρgdz. Taking a gravitational acceleration g of 9.81 m/s2 and a typical surface pressure p of 950 hPa (=95'000 (kgm/s2)/m2)) at Bern, the column mass density of air is: ρ=9684 kg/m2.
Advices:
- As always: if you have serious Python problems, please look in the directory master_solution of p2.zip (Please click it to download).
- Double click on the Python program, e.g., p2a.py, then the Python Editor IDLE will open. Press on "Run module". Possibly, you will have error messages since some software packages (libraries for the Python programming language) are missing. That's normal. You can install the packages in a few seconds in your terminal window. e.g.,
pip3 install matplotlib
Task 1a. "Plot the pressure series as function of time"
Download the programs and material ( p2.zip) and copy it to your work directory. Please have a look at the program p2a.py.
Try to understand the program. Please add some program lines for plotting the p-series in summer 2021 (pressure_Bern_2021.csv; csv stands for comma separated values). It is always important to have a look at the data before the start of the data analysis. Do you see periodic signals in the time series of pressure (hPa)?
Task 1b. "Derivation of the mean daily cycle of pressure in summer 2021"
Please have a look at the program p2b.py. Try to understand how the p-values are averaged as function of Universal Time (0, 1, 2, ...23 hour). Add some program lines and make the plot of the daily cycle pm (UT).
Task 1c. "Repeat Task 1 and 2 but for pressure_Bern_2011.csv"
Please try to remove the 813 hPa-outlier! e.g.:
find the outlier(s) with less than 850 hPa
inan=np.where(p < 850)
p[inan]=float('NaN')
Please use np.nanmean function instead of np.mean (there are several NaN values (Not a Number) in the 2011 pressure series). One NaN value is already enough to destroy the mean value (if you use np.mean).
Are the mean daily cycles of p similar for both years?
Do you think that the daily cycle of p is due to solar tides?
Bonus Task (This is already university level! Don't worry if you don't find an own solution but you may have a look at the master solution): Decomposition of the daily cycle of pressure.
Please run the program p2c.py. It makes a decomposition of the daily cycle of p into the diurnal and semidurnal tidal component. Is the fit okay?
Are the amplitudes and phases similar to those of the article schindelegger_ray_2014.pdf in your p2-folder (Figures 10 and 11 show the annual averages of the tides in pressure)?
Please note that local solar time LST=UT + 7.44*24/360 where 7.44 is the longitude of Bern. In addition: 100 Pa = 1 hPa =1 mbar.
Thank you for testing this training module! Did you enjoy? Have you ideas for improvements? You can reach us by email:
Contact last update: March 2023
